11.3. မြေပြင်ကန်လန့်ဖြတ်ပိုင်းပုံပြမြင်ကွင်း (Elevation Profile View)
Elevation Profile panel သည် line တစ်ခု၏တစ်လျှောက်တွင် elevation data များကို ကြည့်ရှုရန်အတွက် ဘေးဘက်မြင်ကွင်း (side view) များကို နေရာချထားသည့် plotting tool တစ်ခုဖြစ်ပါသည်။ Vector ၊ raster ၊ mesh နှင့် point cloud layer များကို ကြည့်ရှုနိုင်အောင် ပံ့ပိုးပေးထားပါသည်။ Data သည် 2D သို့မဟုတ် 3D အမျိုးအစားဖြစ်နိုင်ပါသည်။
Elevation profile view တစ်ခုကိုထည့်သွင်းရန်  menu ကို သွားပါ။
အလိုရှိသလောက် profile views များကို ထည့်သွင်းနိုင်ပြီး dock လုပ်ခြင်း၊ တစ်ခုနှင့်တစ်ခုထပ်နေခြင်းနှင့် လွင့်နေခြင်း (floating) များပြုလုပ်၍နေရာချထားနိုင်ပါသည်။
menu ကို သွားပါ။
အလိုရှိသလောက် profile views များကို ထည့်သွင်းနိုင်ပြီး dock လုပ်ခြင်း၊ တစ်ခုနှင့်တစ်ခုထပ်နေခြင်းနှင့် လွင့်နေခြင်း (floating) များပြုလုပ်၍နေရာချထားနိုင်ပါသည်။
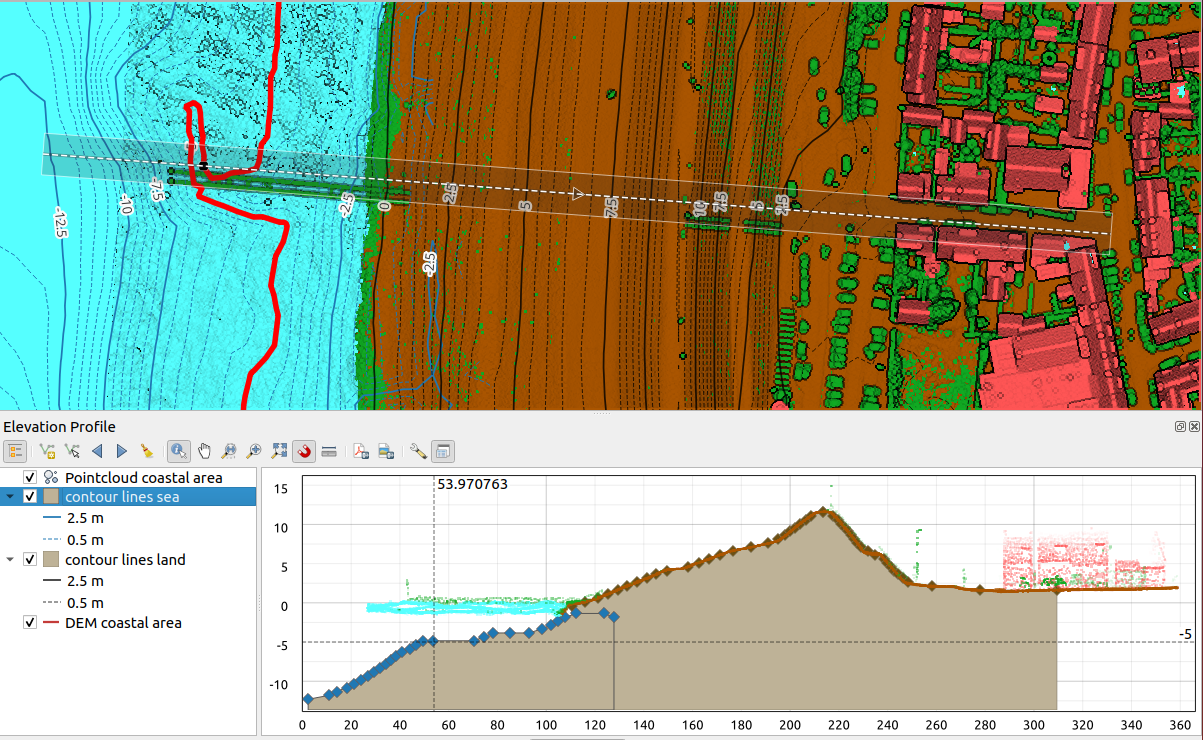
Fig. 11.29 Elevation Profile dialog ကို main map canvas များ၏အောက်တွင် ထည့်သွင်းထားပုံ
ပုံတွင် sea-dike (ကုန်းတွင်းပိုင်းသို့ရေများဝင်ရောက်ခြင်းကို ကာကွယ်ရန် လူဖြင့်ဖန်တီးထားသည့် နံရံ) တစ်ခု၏နောက်ရှိ မြို့တစ်မြို့၏ ကမ်းရိုးတန်းတစ်ခုကိုပြသထားပါသည်။ ကြီးမားသည့်ကွဲလွဲမှု (larger tolerance) ကို elevation profile line အပေါ်သို့သက်ရောက်ခြင်းသည် point cloud features များကို ပိုမိုဖြစ်ပေါ်စေပါသည်။
11.3.1. လုပ်ငန်းဆောင်တာမျက်နှာပြင် (Interface)
Elevation Profile panel ၏ ထိပ်တွင် အောက်ဖော်ပြပါ tools များဖြင့် toolbar တစ်ခုကို ပံ့ပိုးပေးပါသည်-
Tool |
ဖြတ်လမ်းနည်း |
ရှင်းလင်းဖော်ပြချက် |
|---|---|---|
|
Profile view ထဲတွင် rendering ပြုလုပ်ခြင်းကို သတ်မှတ်ရန် list of project layer များကို ပြခြင်း သို့မဟုတ် ဖျောက်ထားခြင်းကို ဆောင်ရွက်သည်။ |
|
|
Profile curve ကို ကိုယ်စားပြုဖော်ပြရန် map canvas အပေါ်တွင် line တစ်ခုကို ရေးဆွဲပါသည်။ |
|
|
Map canvas အပေါ်တွင် လက်ရှိတည်ရှိနေသည့် line feature တစ်ခုကို pick လုပ်ပြီး အဆိုပါ line တစ်လျှောက်တွင် profile curve တစ်ခုကို ထုတ်ပေးပါသည်။ |
|
|
Ctrl+Alt+, |
Map ကို ဖြတ်၍ ရိုက်ကူးထားသော line (capture line) အား ဘယ်ဘက်သို့ ဖြည်းညှင်းစွာ ရွှေ့ရန်ခွင့်ပြုသည်။ (ဥပမာ - elevation အပေါ်အခြေခံ၍ အကောင်းဆုံး profile line တစ်ခုကို ရှာဖွေရန်) |
|
Ctrl+Alt+. |
Map ကို ဖြတ်၍ ရိုက်ကူးထားသော line (capture line) အား ညာဘက်သို့ ဖြည်းညှင်းစွာ ရွှေ့ရန်ခွင့်ပြုသည်။ (ဥပမာ elevation အပေါ်အခြေခံ၍ အကောင်းဆုံး profile line တစ်ခုကို ရှာဖွေရန်) |
|
Elevation Profile view တွင် ဖော်ပြထားသည့် မည်သည့် plot မဆိုနှင့် profile ကို ဖယ်ရှားပါသည်။ |
|
|
Single click တစ်ချက်နှိပ်ခြင်း သို့မဟုတ် ထောင်မှန်စတုဂံကို ဖိဆွဲခြင်း (click-and-drag) ဖြင့် plot canvas များရှိ features များကို identify ပြုလုပ်ပေးသည်။ ရလဒ်များကို standard Identify Results dock တွင် ဖော်ပြထားပါသည်။ |
|
|
Space |
Plot canvas များကို pan ဖြင့် ရွှေ့ရန် ဖိဆွဲပါ။ မောက်စ်၏ အလယ်ခလုတ်ဖြင့်လည်း ဆောင်ရွက်နိုင်ပါသည်။ |
|
Vertical ratio ကို နဂိုအတိုင်းသိမ်းထားပြီး horizontal axis တစ်လျှောက်တွင် Zooms ချဲ့ခြင်း/ချုံ့ခြင်း ပြုလုပ်ပါသည်။ |
|
|
Ctrl+Space |
Plot အပေါ်တွင် zoom ချဲ့ကြည့်ရန် ထောင်မှန်စတုဂံတစ်ခုကို Click နှိပ်ခြင်း သို့မဟုတ် ဖိဆွဲခြင်း (click-and-drag) ပြုလုပ်ပါသည်။ ချဲ့ကြည့်ရာမှ ချုံ့ကြည့်ရန် Alt ကို နှိပ်ပြီး click နှိပ်ပါ။ |
|
Capture line ၏ extent ကို ကြည့်ရှုရန် Elevation Profile view ကို Zoom ချဲ့ကြည့်သည်။ |
|
|
Profile view ထဲတွင် plot features များ၏ အစွန်း (edge) သို့မဟုတ် vertex ကို snap ဖမ်းရန်ခွင့်ပြုသည်။ အကွာအဝေးတိုင်းတာခြင်းများ သို့မဟုတ် ကိုဩဒိနိတ်များကို တိကျအောင်ပြန်လည်ရယူခြင်းတို့အတွက် အဆင်ပြေပါသည်။ |
|
|
Horizontal နှင့် vertical အကွာအဝေးများကို တိုင်းတာသည်။ |
|
|
Plots များကို PDF (အရည်အသွေးမြင့်မားသည့် vector objects များအဖြစ်သို့) အဖြစ်သို့ export ထုတ်ပေးပါသည်။ |
|
|
Plots များကို များစွာသော image formats များသို့ Export ထုတ်ပါသည်။ |
|
|
Profile elevation line ၏ configuration settings များကို access ပေးပါသည်။ |
|
|
View ၏ docked နှင့် floating အခြေအနေများအကြားတစ်ခုမှတစ်ခုသို့ ပြောင်းလဲပေးပါသည်။ |


ဘယ်ဘက်အောက်ဘက်တွင်  Show Layer Tree button ၏ ဘေးတိုက်တွင် Layers panel copy တစ်ခုကို ပြသနိုင်ပါသည်။
သို့သော်လည်း ၎င်းသည် စိတ်ကြိုက်အစဉ်လိုက်ထားရှိနိုင်သည့် visible layer များပါဝင်သော သီးခြား widget တစ်ခုဖြစ်ပါသည်။ ၎င်းသည် plot canvas အတွင်း layer များ ပုံဖော်ပြသခြင်း နှင့် ပြုမူဆောင်ရွက်ပုံများကို ထိန်းချုပ်ခွင့်ပြုပါသည်-
၎င်းကို plot canvas များအတွင်း render ဆောင်ရွက်မည်/မဆောင်ရွက်မည် ကို သတ်မှတ်ရန် layer name ၏ ဘေးရှိ box ကို အမှန်ခြစ်ပါ။
Layers များ၏ အစဉ်များကို ပြောင်းလဲရန် အပေါ် သို့မဟုတ် အောက်သို့ ဆွဲ၍ရွှေ့ပါ (drag-and-drop )။
Profile view ထဲရှိ layer များ၏ style rendering - Configuration ပြုလုပ်ရန်အတွက် layer ၏ Elevation properties tab ကို ဖွင့်ရန် layer တစ်ခုကို double-click သို့မဟုတ် right-click နှိပ်ပြီး Properties… ကို select လုပ်ပါ။
Layer tree ၏ ညာဘက်တွင်ရှိသည့် plot canvas သည် ဖွင့်ထားသည့် layer များ၏ elevation profile များကို ကြိုတင်ကြည့်ရှုနိုင်သည့် အဓိကနေရာများဖြစ်သည်။ ၎င်းကို horizontal axis သည် profile line ၏ length ကို ဖော်ပြပြီး vertical axis သည် တွေ့ရှိထားသည့် features များ (observed features) ၏ Z elevation ကို ဖော်ပြသော graduated grid (အမျိုးအစားအလိုက်ခွဲခြားထားသည့် အကွက်) တွင် အခြေခံထားပါသည်။ ၎င်းသည် ထိပ်ဘက်ရှိ tools များကို အသုံးပြု၍ zooming ၊ panning ၊ measuring ၊ identifying features ၊ … များ လုပ်ဆောင်ခြင်းကိုလည်းခွင့်ပြုပါသည်။
11.3.2. မြေပြင်ဖြတ်ပိုင်းပုံတစ်ခု ဖန်တီးခြင်း (Creating an elevation profile)
Profile view တစ်ခုကို ဖန်တီးရန်-
 menu ကို သွားပါ။
Elevation profile panel သည် ပွင့်လာမည်ဖြစ်ပါသည်။
menu ကို သွားပါ။
Elevation profile panel သည် ပွင့်လာမည်ဖြစ်ပါသည်။Render ဆောင်ရွက်မည့် မြေပြင်အနေအထား (terrain) နှင့် feature များတစ်လျှောက်တွင် profile line ကို ဖန်တီးပါ။ Drawing tool တစ်ခုအား Select ပြုလုပ်ပါ-
 Capture Curve - Vertices များ ထည့်သွင်းရန် main map canvas အပေါ်တွင် left click နှိပ်ပါ။
ထို့နောက် profile line အဖြစ်သုံးမည့် line တစ်ခုကို အပြီးသတ်ရေးဆွဲရန် right click နှိပ်ပါ။
Capture Curve - Vertices များ ထည့်သွင်းရန် main map canvas အပေါ်တွင် left click နှိပ်ပါ။
ထို့နောက် profile line အဖြစ်သုံးမည့် line တစ်ခုကို အပြီးသတ်ရေးဆွဲရန် right click နှိပ်ပါ။သို့မဟုတ်
 Capture Curve From Feature -
၎င်းကို profile line အဖြစ် select ပြုလုပ်ရန် map canvas ပေါ်ရှိ line feature တစ်ခုကို click နှိပ်ပါ။
click လုပ်ထားသည့် အမှတ်၌ multiple features များရှိနေပါက popup menu တစ်ခုပေါ်လာမည်ဖြစ်ပြီး ၎င်းတို့ထဲမှ တစ်ခုကို select ပြုလုပ်ရန် ခွင့်ပြုမည်ဖြစ်ပါသည်။
Capture Curve From Feature -
၎င်းကို profile line အဖြစ် select ပြုလုပ်ရန် map canvas ပေါ်ရှိ line feature တစ်ခုကို click နှိပ်ပါ။
click လုပ်ထားသည့် အမှတ်၌ multiple features များရှိနေပါက popup menu တစ်ခုပေါ်လာမည်ဖြစ်ပြီး ၎င်းတို့ထဲမှ တစ်ခုကို select ပြုလုပ်ရန် ခွင့်ပြုမည်ဖြစ်ပါသည်။
snapping options ၊ tracing ၊ digitizing techniques သို့မဟုတ် advanced digitizing panel ကဲ့သို့သော line digitizing capabilities အားလုံးကို ရယူအသုံးပြုနိုင်ပါသည်။
Plot canvas သည် အချို့သော feature များကို rendering စတင်ဆောင်ရွက်မည်ဖြစ်ပါသည်။
နောက်ထပ်အဆင့်သည် ကြည့်ရှုလိုသည့် layer များ၏ elevation properties များကို ပြင်ဆင်သတ်မှတ် (configure) သည့် အဆင့်ဖြစ်ပါသည်။
Layer များစာရင်းကို ပြသရန်
Show Layer Tree ခလုတ်ကို ဖိထားပါ။အလိုရှိသည့် layer များ၏ visibility ကို အဖွင့်/အပိတ်လုပ်ပါ။ ၎င်းတို့သည် profile view တွင် render ဆောင်ရွက်ထားသည့် layer များဖြစ်ပြီး select ပြုလုပ်ထားသည့် layer များသည် main Layers panel ၏ layer များနှင့် မတူညီပဲ ကွဲပြားနေနိုင်ပါသည်။
Layer name ကို Double-click သို့မဟုတ် right-click နှိပ်ပါ။ ထို့နောက် Properties ကို select လုပ်ပါ။ Layer ၏ Elevation properties tab သည် ပွင့်လာမည်ဖြစ်ပါသည်။ ဤနေရာတွင် profile view အပေါ်တွင် feature တစ်ခုချင်းစီ သို့မဟုတ် terrain ကို မည်ကဲ့သို့ ပုံဖော်ပြသမည်ကို သတ်မှတ်နိုင်ပါသည်။ ရရှိနိုင်သည့် properties များသည် layer အမျိုးအစားအပေါ် မူတည်ပါသည်-
Profile view သည် elevation properties များကို သတ်မှတ်ပြီးသည်နှင့်တစ်ပြိုင်နက် ပေးထားသည့် profile curve ကို ဖြတ်၍ active layers ၏ terrain သို့မဟုတ် features များကို rendering စတင် ပြုလုပ်မည်ဖြစ်ပါသည်။
 Options drop-down menu အောက်တွင် Tolerance တန်ဖိုးကို သတ်မှတ်နိုင်ပါသည်။
အဆိုပါ တန်ဖိုးသည် main map canvas ပေါ်တွင် မြင်ရမည့် elevation profile line ပတ်လည်တွင် flat buffer တစ်ခုကို ဖန်တီးရန် အသုံးပြုပါသည်။
အဆိုပါ buffer နှင့် ထပ်နေသည့် မြင်ရသည့် မည်သည့် visible point feature ကိုမဆို plot canvas တွင် capture လုပ်ထားမည်ဖြစ်ပါသည်။
Options drop-down menu အောက်တွင် Tolerance တန်ဖိုးကို သတ်မှတ်နိုင်ပါသည်။
အဆိုပါ တန်ဖိုးသည် main map canvas ပေါ်တွင် မြင်ရမည့် elevation profile line ပတ်လည်တွင် flat buffer တစ်ခုကို ဖန်တီးရန် အသုံးပြုပါသည်။
အဆိုပါ buffer နှင့် ထပ်နေသည့် မြင်ရသည့် မည်သည့် visible point feature ကိုမဆို plot canvas တွင် capture လုပ်ထားမည်ဖြစ်ပါသည်။
11.3.3. Profile Views များနှင့် အပြန်အလှန်လုပ်ဆောင်ခြင်း (Interacting with the profile Views)
Elevation profile line တစ်ခုကို ဖန်တီးသည့်အခါတွင် plot canvas သည် ၎င်း၏ full extent အထိ zoom ချဲ့မည်ဖြစ်ပါသည်။ X-axis အပေါ်တွင် profile ၏ အလျားကို မြင်နိုင်ပြီး Y-axis အပေါ်တွင် အနိမ့်ဆုံးအမြင့်နှင့် အမြင့်ဆုံးအမြင့်အကြားရှိ ဖမ်းယူရရှိသည့် အမြင့်ပမာဏ ကို တွေ့မြင်နိုင်ပါသည်။ နှစ်ခုလုံးကို မြေပုံယူနစ်များဖြင့်ဖော်ပြမည်ဖြစ်ပါသည်။
Elevation profile view တွင် mouse pointer ကို နေရာရွှေ့သည်အခါတွင် crossing dot lines နှစ်ခုကို တွေ့မြင်ရမည်ဖြစ်ပါသည်-
Vertical line သည် အမြင့်နှင့်သက်ဆိုင်သည့် အချက်အလက်ကို ပြသပါသည်။
Horizontal line သည် elevation profile Line အစမှ အကွာအဝေးကို ဖော်ပြပါသည်။
Elevation profile canvas တွင် mouse pointer ကို ရွှေ့သည့်အခါတွင် main map canvas ပေါ်တွင် elevation profile line တလျှောက် black dot တစ်ခုသည် ရွှေ့နေသည်ကို တွေ့မြင်ရမည်ဖြစ်ပါသည်။ Profile line ၏ အလယ်တွင် မြှားတစ်ခုသည် ၎င်း၏ ဦးတည်ရာကို ညွှန်းဆိုဖော်ပြပါသည်။
Main map canvas အတွက် QGIS သည် plot canvas ပေါ်တွင် navigate လုပ်နိုင်ရန် နည်းလမ်းများကို ပံ့ပိုးပေးပါသည်-
 Pan ကို အလိုရှိသည့် direction (လားရာ) အတိုင်း elevation profile extent ကို နေရာရွှေ့ရန်အသုံးပြုပါသည်။
Mouse ကို ရွှေ့နေစဉ်အတွင်း Space key ကို ဖိထားခြင်းသည် vertical axis (the elevation) ၏ ratio ကို
မပြောင်းလဲဘဲ plot canvas extent ကိုလည်း ရွေ့စေနိုင်ပါသည်။
Pan ကို အလိုရှိသည့် direction (လားရာ) အတိုင်း elevation profile extent ကို နေရာရွှေ့ရန်အသုံးပြုပါသည်။
Mouse ကို ရွှေ့နေစဉ်အတွင်း Space key ကို ဖိထားခြင်းသည် vertical axis (the elevation) ၏ ratio ကို
မပြောင်းလဲဘဲ plot canvas extent ကိုလည်း ရွေ့စေနိုင်ပါသည်။ Zoom X Axis သည် vertical axis (the elevation) ၏ ratio ကို
မပြောင်းလဲဘဲ horizontal axis တစ်လျှောက်တွင် zoom ချဲ့ကြည့်ရန် အသုံးပြုပါသည်။
Axis ၏ အလယ်ရှိ ကလစ်နှိပ်ထားသည့် အမှတ်နှင့်အတူ X axis တစ်လျှောက်တွင် plot ကို ဆွဲချဲ့ရန် left click ကို နှိပ်ပါ။ သို့မဟုတ်
X axis တစ်လျှောက် plot ကို ထောင့်မှန်စတုဂံ၏ အကျယ်အတိုင်း ဆွဲဆန့်ရန် ထောင့်မှန်စတုဂံတစ်ခုကို ဖိဆွဲပါ။
Axis တစ်လျှောက် zoom ချုံ့ကြည့်ရန် Zoom X Axis ကို အသုံးပြုနေစဉ်တွင် Alt ကို နှိပ်ထားပါ။
Zoom X Axis သည် vertical axis (the elevation) ၏ ratio ကို
မပြောင်းလဲဘဲ horizontal axis တစ်လျှောက်တွင် zoom ချဲ့ကြည့်ရန် အသုံးပြုပါသည်။
Axis ၏ အလယ်ရှိ ကလစ်နှိပ်ထားသည့် အမှတ်နှင့်အတူ X axis တစ်လျှောက်တွင် plot ကို ဆွဲချဲ့ရန် left click ကို နှိပ်ပါ။ သို့မဟုတ်
X axis တစ်လျှောက် plot ကို ထောင့်မှန်စတုဂံ၏ အကျယ်အတိုင်း ဆွဲဆန့်ရန် ထောင့်မှန်စတုဂံတစ်ခုကို ဖိဆွဲပါ။
Axis တစ်လျှောက် zoom ချုံ့ကြည့်ရန် Zoom X Axis ကို အသုံးပြုနေစဉ်တွင် Alt ကို နှိပ်ထားပါ။ Zoom ကို သတ်မှတ်အမှတ်တစ်ခုအား zoom ချဲ့ကြည့်ရန် (left click အသုံးပြု၍) သို့မဟုတ်
တိကျသည့် extent တစ်ခုကို zoom ချဲ့ကြည့်ရန် (ဧရိယာအပေါ်တွင် ထောင်မှန်စတုဂံကို ဖိဆွဲ၍) အသုံးပြုပါသည်။
Zoom အသုံးပြုနေစဉ် zoom out လုပ်ရန် Alt ကို ဖိထားပါ။
Ctrl key နှင့်ပေါင်းစပ်၍ zoom ချဲခြင်း သို့မဟုတ် ချုံ့ခြင်း ကို ပိုမိုချောမွေ့စွာ ဆောင်ရွက်နိုင်မည်ဖြစ်ပါသည်။
Zoom ကို သတ်မှတ်အမှတ်တစ်ခုအား zoom ချဲ့ကြည့်ရန် (left click အသုံးပြု၍) သို့မဟုတ်
တိကျသည့် extent တစ်ခုကို zoom ချဲ့ကြည့်ရန် (ဧရိယာအပေါ်တွင် ထောင်မှန်စတုဂံကို ဖိဆွဲ၍) အသုံးပြုပါသည်။
Zoom အသုံးပြုနေစဉ် zoom out လုပ်ရန် Alt ကို ဖိထားပါ။
Ctrl key နှင့်ပေါင်းစပ်၍ zoom ချဲခြင်း သို့မဟုတ် ချုံ့ခြင်း ကို ပိုမိုချောမွေ့စွာ ဆောင်ရွက်နိုင်မည်ဖြစ်ပါသည်။ Zoom Full သည် စတင်သည့်အချိန်တွင် အသုံးပြုသည့် default zoom level ဖြစ်ပြီး ပြန်ထွက်လာသည့် feature များအားလုံးနှင့်အတူ
profile line ၏ full extent ကို ပြသပါသည်။
Zoom level ကို မူလအတိုင်း reset ပြုလုပ်ရန် ၎င်းကိုအသုံးပြုပါသည်။
Zoom Full သည် စတင်သည့်အချိန်တွင် အသုံးပြုသည့် default zoom level ဖြစ်ပြီး ပြန်ထွက်လာသည့် feature များအားလုံးနှင့်အတူ
profile line ၏ full extent ကို ပြသပါသည်။
Zoom level ကို မူလအတိုင်း reset ပြုလုပ်ရန် ၎င်းကိုအသုံးပြုပါသည်။
Plot canvas တွင် ဖော်ပြထားသည့် elements များနှင့်လည်း ချိတ်ဆက်ဆောင်ရွက်မှုများပြုလုပ်နိုင်ပါသည်-
တိကျသည့် အတိုင်းအတာများ သို့မဟုတ် ကိုဩဒိနိတ်အစီအရင်ခံစာ (coordinates report) များအတွက် feature များ၏ points ၊ vertices သို့မဟုတ် edge များကို တိကျစွာဖမ်းယူနိုင်ရန်
 Enable snapping ခလုတ်ကို နှိပ်ပါ။
 Identify Features ကို layer tree ထဲရှိ မြင်နိုင်သည့် visible layer များ၏ feature များကို ဖော်ထုတ်ရန် အသုံးပြုပါသည်။
၎င်းတို့ကို query စစ်ထုတ်ရန် profile view ထဲတွင် များစွာသော feature များကိုဖြတ်၍ ထောင့်မှန်စတုဂံတစ်ခုကိုဖိဆွဲနိုင်ပါသည်။
Format နှင့် ကိုက်ညီမှုရှိသည့်အခါ (ဥပမာ - vector ၊ point cloud) ဤ feature များသည် main map canvas တွင် သိသာထင်ရှားစွာဖော်ပြမည် (highlighted) ဖြစ်ပါသည်။
Identify Features ကို layer tree ထဲရှိ မြင်နိုင်သည့် visible layer များ၏ feature များကို ဖော်ထုတ်ရန် အသုံးပြုပါသည်။
၎င်းတို့ကို query စစ်ထုတ်ရန် profile view ထဲတွင် များစွာသော feature များကိုဖြတ်၍ ထောင့်မှန်စတုဂံတစ်ခုကိုဖိဆွဲနိုင်ပါသည်။
Format နှင့် ကိုက်ညီမှုရှိသည့်အခါ (ဥပမာ - vector ၊ point cloud) ဤ feature များသည် main map canvas တွင် သိသာထင်ရှားစွာဖော်ပြမည် (highlighted) ဖြစ်ပါသည်။ Measurement Distances - အမှတ်နှစ်ခုအကြားရှိ horizontal Distance ၊ Elevation
နှင့် Total distance ကို ဖော်ပြရန် (map unit များဖြင့်) plot canvas ထဲရှိ အမှတ်နှစ်ခုကို click သို့မဟုတ် select လုပ်ပါ။
Measurement Distances - အမှတ်နှစ်ခုအကြားရှိ horizontal Distance ၊ Elevation
နှင့် Total distance ကို ဖော်ပြရန် (map unit များဖြင့်) plot canvas ထဲရှိ အမှတ်နှစ်ခုကို click သို့မဟုတ် select လုပ်ပါ။Map canvas ထဲရှိ elevation profile line များ၏ တည်နေရာကို ဘယ်မှညာ သို့မဟုတ် ညာမှဘယ်သို့ ရွှေ့ရန်
 Nudge Left နှင့်
  Nudge right များကို အသုံးပြုပါသည်။
Plot canvas ကို profile line buffer နှင့်ထပ်တူကျနေသည့် features နှင့် terrain များကို ဖော်ပြပြီး ပြန်လည်ရေးဆွဲမည်ဖြစ်ပါသည်။
Options menu ထဲရှိ Tolerance တန်ဖိုးကို အသုံးပြုခြင်းဖြင့် line ကို ဘေးတိုက်ရွှေ့သည်။
Nudge right များကို အသုံးပြုပါသည်။
Plot canvas ကို profile line buffer နှင့်ထပ်တူကျနေသည့် features နှင့် terrain များကို ဖော်ပြပြီး ပြန်လည်ရေးဆွဲမည်ဖြစ်ပါသည်။
Options menu ထဲရှိ Tolerance တန်ဖိုးကို အသုံးပြုခြင်းဖြင့် line ကို ဘေးတိုက်ရွှေ့သည်။
Warning
Elevation profile တစ်ခု သို့မဟုတ် project ကို ပိတ်လိုက်ခြင်းသည် project မှ လက်ရှိ view ကို ဖယ်ရှားလိုက်မည်ဖြစ်သည်။
အသေးစိတ်အချက်အလက်များအတွက် Nyall Dawson ၏ presentation QGIS elevation profile/cross section tool – a deep dive! ကို ကြည့်ရှုပါ။